


How to Use JTDB to Identify and Disrupt Competitors
By Solving the Job and Messaging Better

Have you ever been frustrated by feature-matrices that showcase the maker’s brand with green ✅’s down the fist column of features and every other brand has mostly red ❌’s?
Even more confusing is when you go to the next brand’s website only to find a matrix using completely different language and - behold! - they have all the green check marks. People make their careers on this stuff — right up there with people who make a living switching brand logos every 18 months (about the average tenure of a CMO, by coincidence! 🤔).
This is mostly for two reasons:
They use different word salad to describe sub-categories within their overall solution category
The don’t frame the categories from the customers’ perspective - an outcome
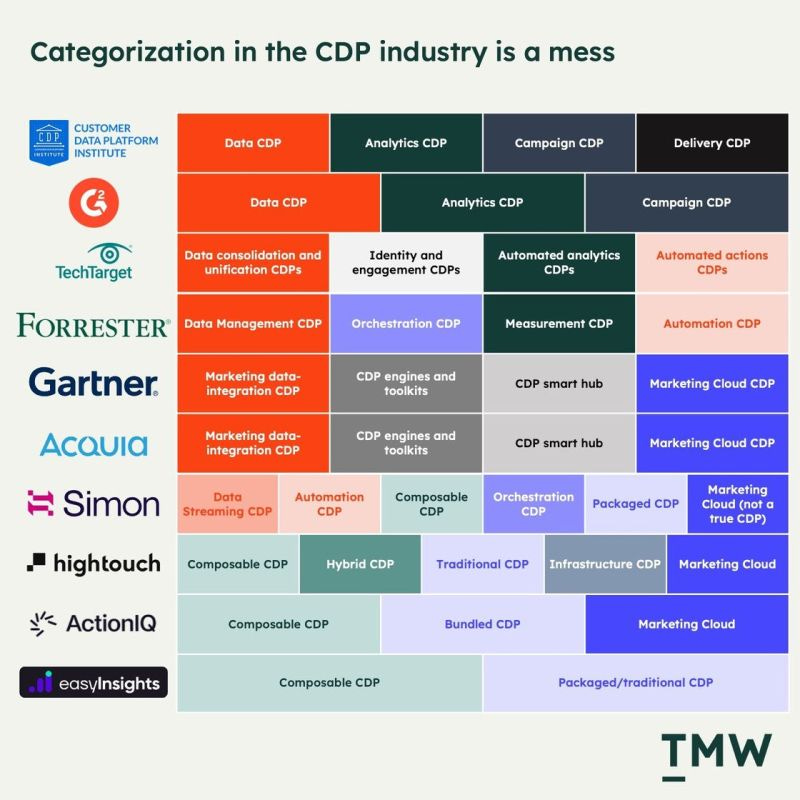
Here’s an example of what I mean that I recently spotted on LinkedIn. Clearly, I’m not the only one who has come to this conclusion
I’m going to show you how you can use (real) Jobs-to-be-Done to compare and contrast your product (or one that you use as a part of your toolset) against against any competitor. I promise not to make assumptions, and I promise not to place brand logos in a 4-quadrant matrix arbitrarily and present it as a non evidence-based fact. I’m not here to con you 😇.
I’m going to show you a proper method of categorizing an industry solution-set using jobs-thinking, and dive deeper into how to compare and contrast brands against each other in a way that’s actionable
So, let’s break this down.
The Assumptions & Pre-conditions
There are some basic assumptions we need to make:
We do not measure or compare features of a product
We do identify what customers are trying to accomplish
We do measure how they perceive success
And we do this in the context of the solution they are using
Most research focuses on a small portion of #4, regardless of their wild claims to the contrary. While similar products may have similar features, they are generally labeled differently (cuz that’s how you differentiate) and they do not have a direct relationship with the customer’s end goal. They simply do things, e.g., we integrate marketing data in a CDP, etc. They don’t address the why clearly.
In order to perform a highly differentiated competitive analysis, your data needs to be completely product agnostic — but you do need to wrap the prioritization tightly around the solution that a particular customer uses. This is only to provide the context we need to perform the competitive analysis. To that end, you also need to capture a proportional sample of end users who use the various competing solutions you’d like to compare.
After that, they all answer the exact same questions. You simply cannot make this stuff up in a workshop.
The Data
I’ve said this before - sigh - but a canvas, or a whiteboard, or sticky notes, are not a replacement for real forward-looking measures that have been tested in the market — returning actual prioritization data. You need data - not theater, or donuts. However, coffee does help! ☕
We’re trying to answer the why question.
Job Maps or Not
Job Maps are extremely helpful for humans who need to organize the capture of information. In the age of artificial intelligence (AI), not so much. Having said that, while you don’t need to have AI output job maps, it’s still beneficial to instruct them to think through their analysis using this sort of framework. AI can always organize the the outputs by job steps after-the-fact, if necessary.
…and in the case of competitive analysis, I find it beneficial to frame the analysis at the step level first, so you can assume that I generate job maps for this (for smaller, shot-gun studies you simply don’t need them to be successful). My example below actually frames them at the job level (as in, CDPs actually help customers accomplish multiple jobs).
Desired Outcomes or Not
The success metrics used in your research are the foundation of the competitive analysis. They replace the features we always see. Why? Because the outcomes are common in the end user view of a market, so the brands are supposed to be accommodating those outcomes. This will allow us to compare brands in a single matrix using a common, outcome-based set of attributes.
Now, do they need to be in the Desired Outcome format? Absolutely, they should not be. No one talks like that, or thinks like that. They’re over-engineered, frankly. In my experience, stakeholders (especially marketing clients) push back hard on that format. It’s a clear signal that you need to adapt. So, I have.
Present them to stakeholders the same way you present them to the market!
So, I’ve developed AI prompts that can output in a variety formats. You don’t need AI, though. In fact the statements we capture from interviews never come out like a desired outcome statement. That structure is contrived. Just stick with the statements you hear, but definitely do remove any mention of a product or solution, and try to re-structure them so they’re consistent and don’t drain the energy of a survey respondent. You just don’t need to add anything on top of that.
The Prioritization
The goal is to compare your brand against competing brands on the basis of how well you each enable success. Think of the success metric as a brick that supports the pillar (the step). We’re trying to learn how well each brand supports the success of that step at a more granular level — not just the step itself.
You can take a couple of approaches.
Ranks: there are two basic types types of rank.
Value-Adding: this represents success measures that are underserved. The higher the rank (1 being the highest), the more underserved the respondent or group is.
Value-Claiming: this represents success measures that are overserved. The higher the rank (1 being the highest), the more cost and complexity should be removed for the respondent or group.
Scores:
Ranks are probably more mental gymnastics than a marketing team will want to navigate. For basic comparative purposes, a score (the first step toward a rank) may still be the best approach. I don’t recommend using a metric-model as your scoring formula - like the opportunity score. Instead, use an ordinal scoring mechanism that treats every response the same and doesn’t lose signal in the theater of algorithms. You can establish boundaries in the range of scores that indicate whether something is relative underserved, or overserved. It’s just less of a prioritization than a rank.
By scoring success measures the exact same way for each brand, we can then compare their ability (according to their customers) to successfully enable (or overly-enable) each measure with great precision. This is a vastly superior approach than jumping through all of the hoops to reconcile workshopped categories like the ones I shared above.
It’s also beneficial to understand what percentage of the population perceives the measure as highly important.
The Presentation

This is probably what you’ve been waiting for. So, what can you do with this information? Here some ideas (feel free to let me know if you have some others):
Catchup and Promote: use this when the competition is scoring better than your brand, but your competitors aren’t messaging to it. Be sure to consider the size of the audience that rates the measure for each brand. It’s possible that while a competitor is outperforming, only a small portion of the market cares.
Improve Performance and Promote: use this when no one is addressing a measure well.
Message to the Void: use this when everyone is performing well and the size of the audience is very large. This will connect with customers across brands regarding something they value that only you are talking about. It’s like b****-slapping the competition; all that work and they don’t even realize the value.
Message to your superiority: use this when you are outperforming the competition on a measure that has a sizeable portion of the audience.
Do not message to outcomes you don’t address well. That would be a lie. 🤥
Developing a Frame
This depends heavily on the types of questions you’re trying to answer. What I’m demonstrating below is not based on a job map; although that’s commonly what we do. In this case I created 4 Jobs that might be enabled by a CDP. There are certainly far more than this. No problem, I can produce more if needed 😉. It would take humans a few weeks, and a lot of theater to do the same.
Next, each job has two (2) success metrics. Clearly, we commonly gather well over 100 of these for each job. In an analysis like this, I’d probably recommend 10 metrics per job and maybe 5 or 6 jobs. I didn’t do that here because…
I don’t have the room, and you don’t have the time
I can’t share data for these markets (at the moment), and the less I have to make-up, the better!

Now, if you look up at the categorizations that have been identified by the brilliant marketing teams of each brand in the first figure, you’ll see that they are abstract concepts (to casual observers), or things we built and want you to want them.
I mean, most regular people (customers) don’t know what the term composable means, and I’m not so sure we all define traditional the exact same way, either.
Word salad comes to mind.
I recommend - instead - that if you already have a solution you should go through the exercise of identifying what jobs-to-be-done your solution enables customers to accomplish. Then use those as your categories. They are far more customer-centric! As a result, they’ll connect with your audience more effectively.
But, I recommend that you go a level deeper than that. In my opinion it’s critical that you identify and talk about outcomes that your customers will use to judge you. This is how you can connect with them quickly, and efficiently.
Here’s how this works…
Analysis even a simpleton like me can understand
I’m all for simple visualizations. If you have to explain it in great detail, it loses it’s effectiveness. Remember, your stakeholders are busy people who are not immersed in the topic like you are. Don’t ask them to be data scientists. Make the patterns obvious. So, let me attempt to explain the visualization above🤣!
Brands
These are across the top and include your brand and as many others as you can afford to study. It ain’t cheap to add more because it drives your sample size up.
Jobs
These are in the left-most column. If you’re only studying one market, these would be job steps. There’s some nuance here, but I’m not getting into that here. My posts are already too long!
Success Metrics
You’ll notice that I don’t use over-engineered language and I frame them to look more like a capability — beginning with the ability to… A complete set would probably have between 70-100 of these, but only a handful would be worth taking action on, so don’t let that range scare you. This is more of a raw look at the results. By the time you’re ready to talk to your stakeholders, you’ll have reduce this down to a handful of things to take action on.
Score
Which ever way you decide to score your success metrics (importance and satisfaction, importance and effort and frequency, etc.) I’ll leave up to you. But you should be clear on what the range of the score is (or index it) and be clear on where you define your breakpoints; like underserved and overserved. For example, above you might declare that 5 and below as being underserved. This tells you that any metric 5 or below is something that needs to be improved.
Size
This is a market-derived determination of what portion perceive a success metric to be very important (regardless of sat or effort). For example, if you have an advantage over everyone else (message to your superiority) then only invest in messaging if the size of the audience is worthwhile. If it’s 5% of the market, why bother? You might actually be overserving that group. On the other hand, if it’s 60%, that’s a lot of people that could be swayed just on messaging alone.
In Conclusion
Data Streaming CDP <> Segmenting Audiences — OR — The ability to create granular customer segments based on unified data
What are your customers really looking for, and why are they looking for it?
Any questions?
Mike Boysen - www.pjtbd.com
Why fail fast when you can succeed the first time?
Book an appointment: https://pjtbd.com/book-mike
Grab my JTBD Masterclass: https://mc.zeropivot.us/s/mc-1
Get the whole customer management thing done on a single platform:
https://pjtbd.com/tech-stack