


I can never remember the formula for the ODI Opportunity Score. It’s mostly because I only allocate memory to things that I find important in my daily life. I can always look it up if I have to. But more to the point, anything that looks convoluted should be reconsidered. I mean, we’ve been these things for decades and I don’t feel like we need new algorithms to accomplish fairly standard things. I mean, a recipe is technically an algorithm.
Frankly, I don’t believe the opportunity score is an algorithm at all. It’s simply a formula. It doesn’t fit into any of the definitions of algorithm that I can find (I didn’t look hard). It’s a formula.
Anyway, the fact that it’s pitched as an algorithm is simply confounding when we can simply refer to it correctly as a formula. But, the set of inputs does not make it clear as to how the formula can be used to do the two critical things it needs to do:
Rank the customer success metrics (from the ground up)
Make the distance (weighting) between ranking points transparent
Actually, the second point has to come first. So let’s take a dive into a simpler way to rank customer success for Jobs-to-be-Done and why it is so important. 👇🏻
In a perfect world, we’d use far more than 2 data points to determine a priority. Importance and Satisfaction are low fidelity indicators; and as I’ve talked about, Satisfaction is possibly the worst indicator because it’s a very mushy word, and not only is it vague and open to interpretation, it’s a lagging indicator as well. Why anyone would use this to figure out what to do in the future is beyond me. 🤷🏻♂️
So what should we replace it with? I’ve proposed that we use Difficulty or Effort. While these words are closer to leading indicators, a case could be made that there are more than one type of effort or difficulty, e.g., mental, physical, etc. There are also other things that might considered, especially if you are simply ranking jobs enabled by a platform. But let’s stick to customer success metrics, where we need to constrain ourselves due to survey length.
I propose that we capture three data points for ranking and weighting:
Importance: How important is it that you are able to …
Frequency: How frequently do you need to …
Frustration: Given your current solution / approach, how frustrated are you when you need to …
Sure, I could use difficulty or effort here. In fact, that would be a worthwhile experiment to see how conclusions might differ; but I haven’t done that yet. Frustration has been an input into ranking formulas for a long time. And frequency, well, just as with jobs themselves, it’s quite possibly that steps, and or metrics may not be relevant as frequently as others. This is especially true when automation begins to resolve the consumption chain - or as I’ve written the elimination of the struggle stack and the struggle multiplier.
Low frequency would be a good indicator that solutions have begun to improve the end user situation
In the following scenario, the score is not the rank
When the rating points are on a scale of 1 to 5, this will give us a range from 2 to 50
Importance
1 = Not important
3 = Neutral
5 = Very important
Frequency
1 = Never
3 = Neutral
5 = Very frequently
Frustration
1 = Not frustrated
3 = Neutral
5 = Very frustrated
Therefore if we have a response that is 1:1:1 we get
And if we have a response of 5:5:5 we get
Our range of possible scores is therefore 2 to 50. I know, not very elegant if you’re anal retentive. But, a helluva lot simpler, and more defensible.
So, now whe have a score for each metric, for each respondent. No, I don’t need to aggregate this and move decimals over and then run it through another equation (formula). With things like DAX (Power BI) I can roll these up dynamically as needed, and now I have scoring data at all levels, not just the aggregate (by metric). You just never know when you’ll need something an executive can understand.
Next, we’ll need to rank these. There are a number of ways to do this. We could create a scale between 1 and 100 and calculate these out to a few decimal points to determine who wins ties. Or, we can simply rank them based on the number in the population being ranked; a scale of 1 to COUNT. This could be step-by-step, or you might need to group them differently based on the question your asking.
Since this isn’t going to be a lesson in dynamic calculations across different dimensions I’m just going to use an example of 13 metrics for specific job step. In the formula (not algorithm) below we’re using the RANK.EQ function in Excel (normally I’d be in Power BI using DAX) to look at the metric’s score relative to the range of scores (a range of cells).
It only took me to figure this out after asking ChatGPT to do it 30 times. 🤯
As you can see the 13 metrics are scored from 2 to 50. That doesn’t mean you’ll always have this range. I was simply demonstrating that 1-1-1 is going to be scored a 2 (always) and 5-5-5- is going to always be scored a 50. In other words, if it’s not important, and they don’t face it frequently (or at all) and they’re not frustrated the score will be low

However, the Rank is always going to be between 1 and the number of items in the dimension you are analyzing…in this case metrics per step. So, you see 1 through 13 (the number of metrics in the step (and you can assume the scores are average across respondents in this example.
The next concept - one that I never saw at Strategyn - except when I hired them for a project and asked - is the concept of calculating the distance between ordinal ranks … because not all ranks are equivalent. There’s a degree of magnitude between these ranking points and if we’re trying to decide what we should be considering in a strategy formulation, distance matters. Also, your capabilities matter, but that’s another topic.
In the table above, you can see that the distant between Rank 1 and Rank 2 is not 1. It's actually 8. And the distance between Rank 1 and Rank 4 is actually not 3, but 25. Now, when you starting cutting your data (by dimensions or segmentations) you will see these rank weightings change - just like Opportunity Scores do. So, as you’re cobbling together ideas about how to resolve high priority items, one size will not fit all, or at least one group will not prioritize #2 the same was as another group, for example.
Glad I could muddy the water.
In closing, I should mention that you can also rank respondents within a specific metric, or job step (roll up of metric scores). To do this, you need to calculate scores a the respondent level for everything they answer (that’s scored).
Off the top of my head, while importance and satisfaction scores are known at the individual respondent level, the opportunity score inputs are aggregates. Therefore, you’d need to run the ratings through a different algorithm - which is what I’m doing.
For Fun
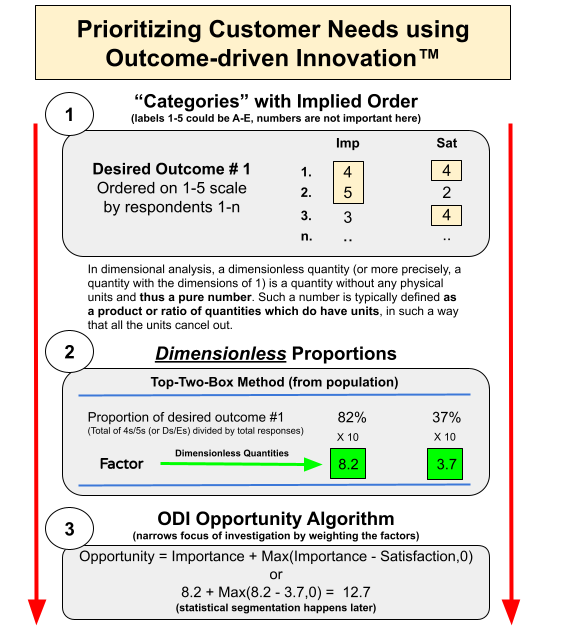
Here’s a placemat I did a number of years back (before my Strategyn days) defending a hilarious attack by the guy who invented Jobs-to-be-Done in 2014, or something. These will explain how the ODI version (kind of) works. The first is what you need to defend the approach because some photography majors - not all - don’t understand statistics.
And once we’ve established that beachhead, we can describe how they are used to calculate the Opportunity Score. Frankly, given bias I’ve seen in the Likert scales (no neutral) a top-two box approach would seem to (or does 😉) bias the results toward being more underserved than they actually are. But, I’ll leave that debate to others.

Share this post